
I’ll get to appexels in a minute ! Selfies, profile pics and status update pics are cool. I had taken Image Processing course back in college thinking it was fun. Most of the times the class was really fun and I learned pretty good stuff along with the complex math involved which left me kind of amazed (only for a few days, I used to bunk lectures 😛😅)
I’ll be doing some random experiments and stuff with images and keep sharing to revise my concepts and hopefully help someone learn something. If you can correct me that’ll be a big plus !
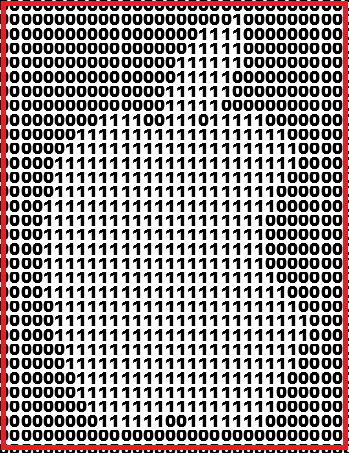
Most images are a matrix of values, the values tell the program how to construct it on the screen. You can see 3 images above an apple, image of an apple converted to a set of 0s & 1s and a zoomed in version. 1 being a bright pixel and 0 a dark one. What you see is a matrix with each row and column representing what to show on the screen. In a simple LED screen a 0 says turn off the LED and 1 says turn on the LED. You can make out just looking at the matrix itself that it’s an apple. For color images it’s not that apparent.

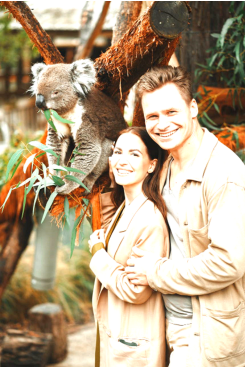
So color images have something more than just 1s & 0s. For a RGB image format the values range from 0 – 255 instead of just 1 & 0. These values give a more control on how strong or light (bright/dim) the value will be represented in an image. For making up the colors however the values are adjusted such that the mix of values produces the desired colors. This is done by having a set of 3 values between 0 – 255, each for a primary color. i.e red, green and blue. Highlighted lines of code below can be changed to get different RGB combinations. Link to complete file
from matplotlib import image #for working with images
from matplotlib import pyplot #for plotting stuff on graphical gui

matrix = image.imread('p.png') #read file
#indexes for rgb values in a array of matrix values
red = 0
green = 1
blue = 2
opacity = 3 #PNG format allows controlling transparency of image

for row in range(len(matrix)): #cycle through each row in the image
    for column in range(len(matrix[row])): #cycle through column of pixel in the image
        matrix[row][column][red]=matrix[row][column][red] #keep red
        matrix[row][column][green]=0 #remove green
        matrix[row][column][blue]=0 #remove blue

pyplot.axis('off')
pyplot.imshow(matrix)
pyplot.show()
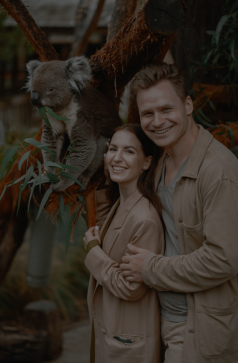
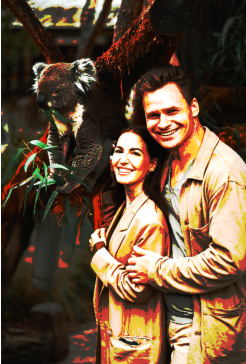
Some arithmetic calculations on these values like add, sub, multiply, divide. Highlighted line of code below can be changed to get different visual properties. Link to complete file
from matplotlib import image #for working with images
from matplotlib import pyplot #for plotting stuff on graphical gui

matrix = image.imread('p.png') #read file
#indexes for rgb values in a array of matrix values
red = 0
green = 1
blue = 2
opacity = 3 #PNG format allows controlling transparency of image

for row in range(len(matrix)): #cycle through each row in the image
    for column in range(len(matrix[row])): #cycle through column of pixel in the image
        for value in range(len(matrix[row][column])): #cycle through rgb values for a pixel in the image

            # ADD A VALUE
            if(value!=opacity): #need not change opacity
                matrix[row][column][value]=matrix[row][column][value]+0.5 # 0 is least 1 is max

pyplot.axis('off')
pyplot.imshow(matrix)
pyplot.show()
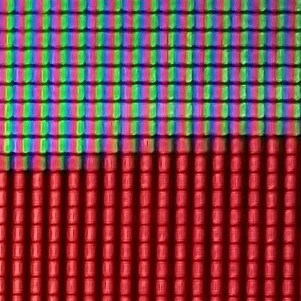
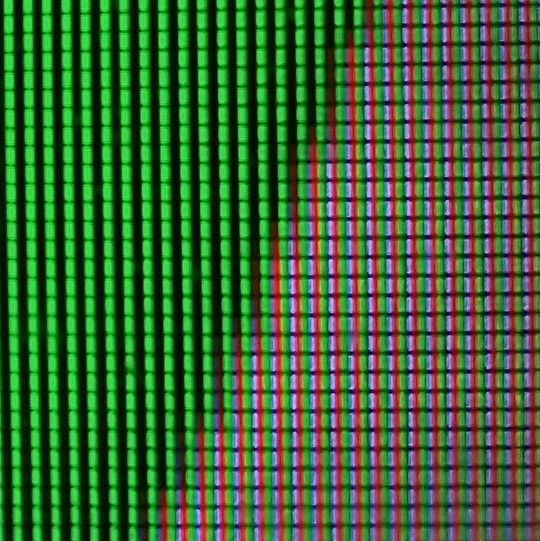
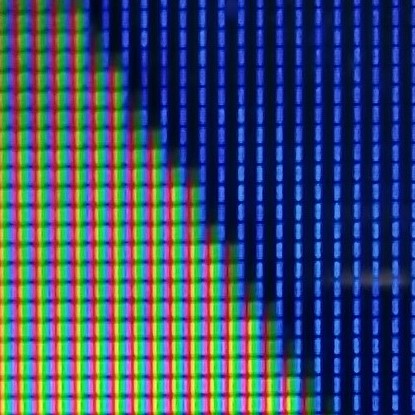
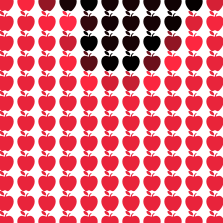
When the screen tries to display the image you can see these values inside the matrix on the screen. Checkout the zoomed in version of red circle, it’s half white and half red as you can see from the original picture. The LCD screen has 3 sub pixels for each pixel and you can see them turn on and off depending on the color being displayed. In the red region you just have the red sub pixels active and in the white region you can see all three sub pixels active. We need all three primary colors to produce white color. The images of the screen are dark and blurry because I took these macro shots from a mobile camera.
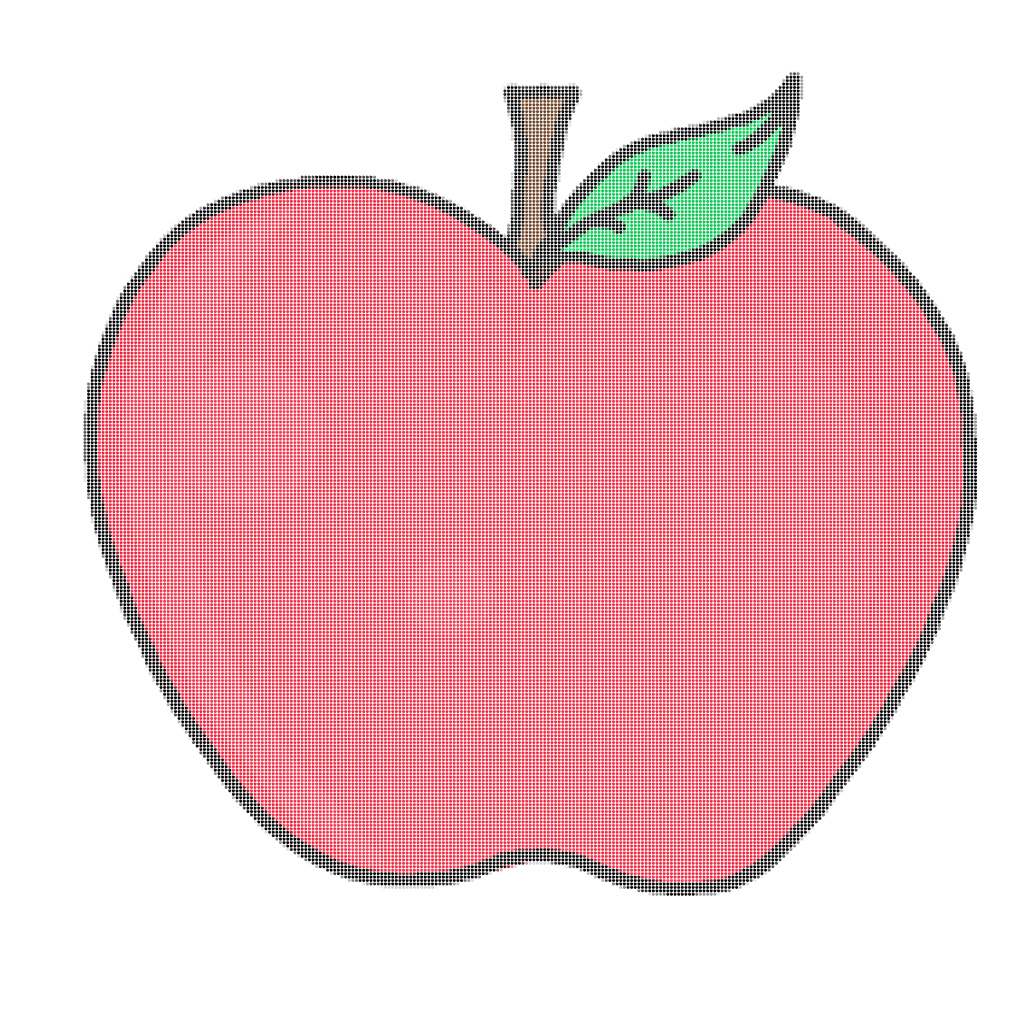
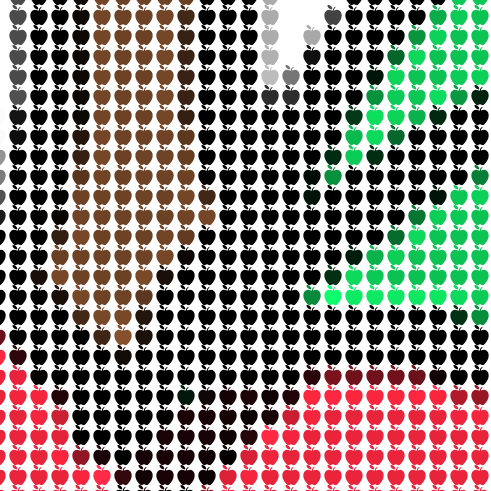
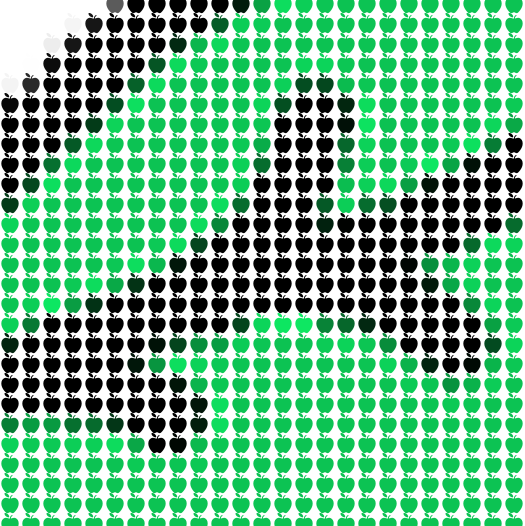
Here’s a fun one, I wrote a small script to convert a regular image of an apple into one with all pixels made up of red apple emoji. Link to complete file. Link to full resolution image. Well not really pixels, virtual pixels or VIXELS !? 🤔 🥁🥁🥁🥁🥁🥁🥁🥁🥁🥁 APPXELS ! no there’s nothing such as appxels just made it up
from PIL import Image, ImageDraw, ImageFont #for drawing image
from matplotlib import image #can be done with PIL probably, just for code reuse

matrix = image.imread('apple.png') #read file

#indexes for rgb values in a array of matrix values
red = 0
green = 1
blue = 2
opacity = 3 #PNG format allows controlling transparency of image

scaling = 20 #scale factor for text size, spacing, line heighting, image dimensions
character = "\U0001F34E" #red apple emoticon unicode
canvasColor = (255, 255, 255)
dimension = len(matrix) # height = width, sq image

font_path = "seguiemj.ttf" #font to work with emoticons
font_size = scaling #set font size

img = Image.new('RGB', (dimension*scaling, dimension*scaling), color = canvasColor) #create canvas for image
d = ImageDraw.Draw(img) # draw into this canvas
font = ImageFont.truetype(font_path, font_size) #set font properties

for row in range(dimension): #cycle through each row in the image
    spaceCounter=0 # to space out the pixel apples
    for column in range(len(matrix[row])): #cycle through column of pixel in the image
        # color as per value
        redVal=matrix[row][column][red] #redness
        greenVal=matrix[row][column][green] #greeness
        blueVal=matrix[row][column][blue] #blueness
        hText = column+spaceCounter*scaling #scale and space out every pixel apple
        vText = row*scaling #space out every row
        d.text((hText,vText), character, fill=(int(redVal*255), int(greenVal*255), int(blueVal*255)),font=font) #place the appexel (apple) with color as per original image in corresponding coordinates
        spaceCounter+=1 #push every pixel apple in row further away

img.save('apples.png')
Will add more … thanks for checking out !