TL;DR: Anthropic dropped the visible context counter from Claude Code for a cleaner UI. Without it I can’t tell how full the window is, so auto-compaction fires when I don’t want it to. I built a status line that always shows it, and that now also surfaces my account rate limits (the 5-hour session window and the weekly limit) on the same line, read from the same stdin payload at zero API cost. ~120 lines of Python, no dependencies, full script in a gist.
The Goal
Claude Code shows a footer, but I wanted an always-on meter for the one number that actually decides when a session falls apart: how full the context window is right now. Percentage, a bar, and the last turn’s output tokens, colour-coded so I notice before auto-compaction hits.
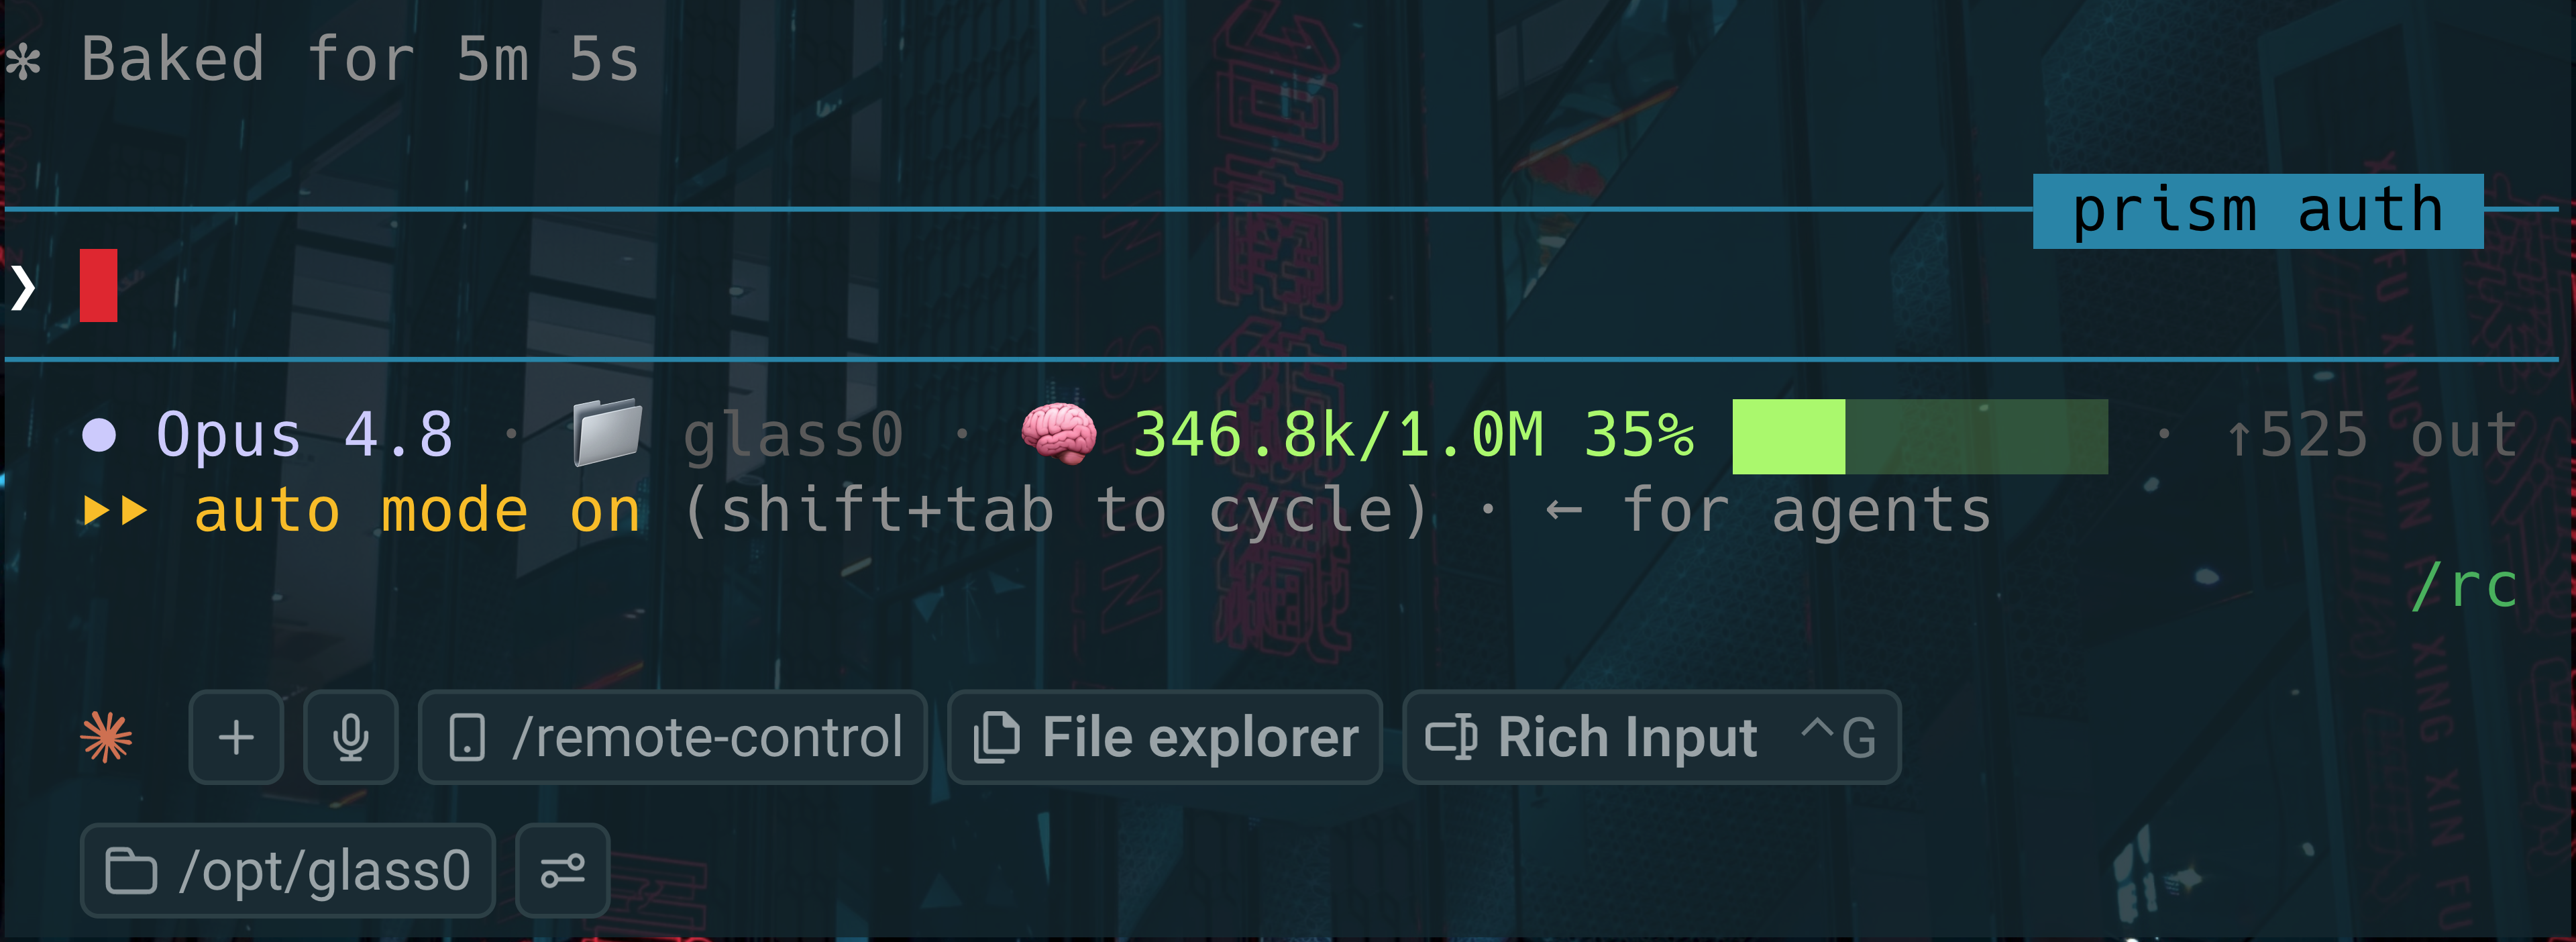
The same idea extends to the other numbers that decide whether I can keep working
at all: the account rate limits. Claude Code tucks them behind the /usage
screen, but they ride along on the same stdin payload, so the line now shows the
5-hour session window and the weekly limit right next to the context meter, each
with its own bar.
How the status line wires into Claude Code
Claude Code has a status line hook: you point it at any command, and on every render it pipes a JSON blob describing the session to that command’s stdin. Whatever the command prints becomes the status line.
The JSON on stdin includes the model, workspace, and, since Claude Code
v2.1.132, a native context_window object with the numbers already computed:
| |
The key field is context_window_size: Claude Code reports the real window,
200000, or 1000000 for extended-context models, so the script never has to
guess a denominator per model. That single field is what makes the meter correct
across models instead of hardcoding 200k everywhere.
The rate_limits block is the other half: five_hour.used_percentage and
seven_day.used_percentage are the same numbers the /usage screen draws, now
handed to the status line for free. More on those below.
The script
The whole thing is ~120 lines of dependency-free Python. Read context_window
and rate_limits, compute a colour and a bar for each, print one line. It falls
back to reading the transcript JSONL for older Claude Code that predates the
native context field, and it quietly skips any rate-limit window that is not
present. The full, copy-pasteable version lives in this GitHub gist.
| |
Setup
| |
No dependencies beyond Python 3, and the status line runs locally, so it costs zero API tokens.
Features
- Auto-detects the window. The header shot above is a 325.2k session on a
1M-context model, reading
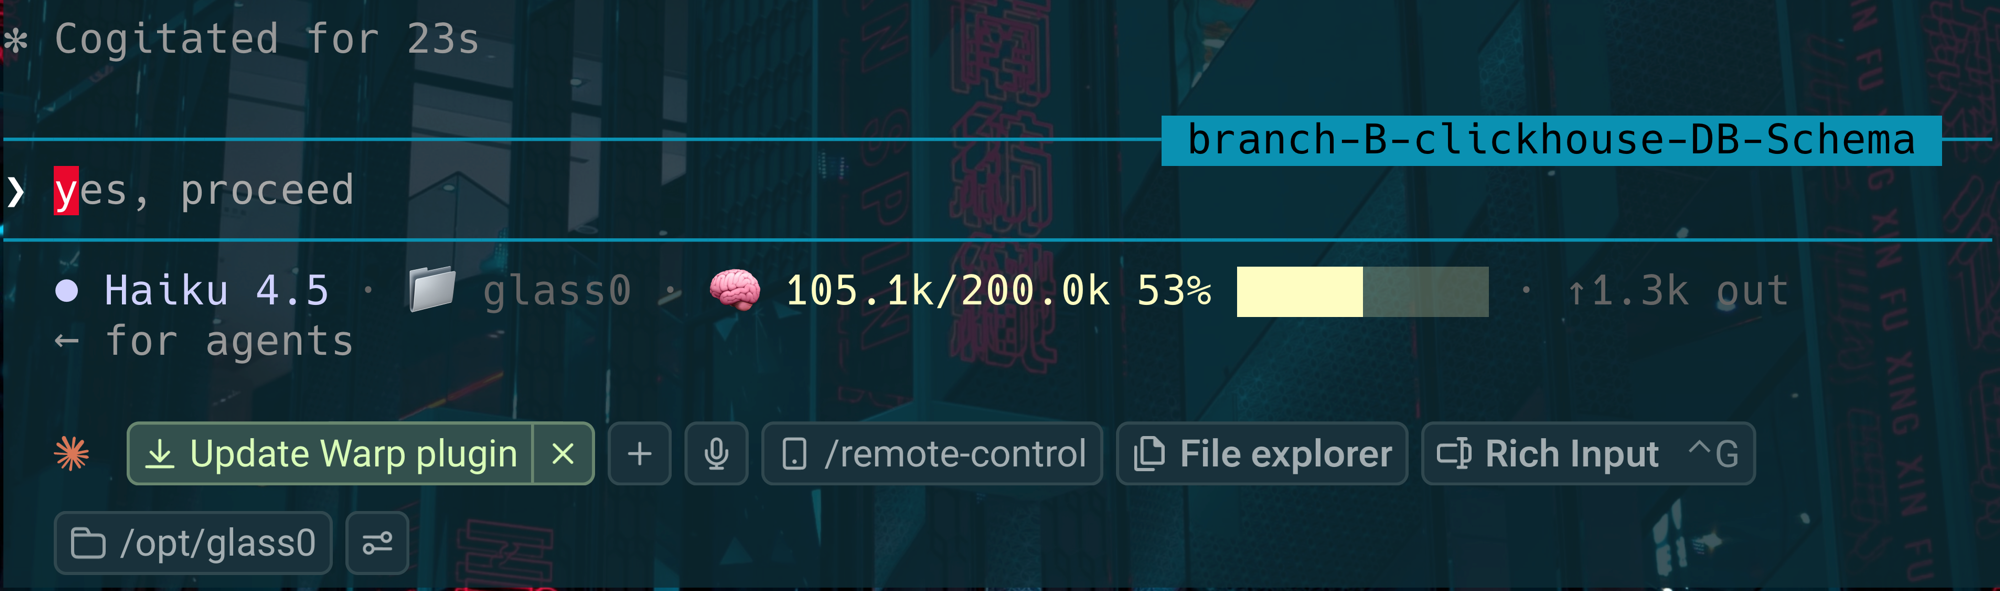
325.2k/1.0M 33%. The size comes straight fromcontext_window_size, so there is no per-model table to maintain: switch to a 200k model and the denominator follows. - Colour-coded urgency. Green under 50%, yellow under 80%, red beyond, so a filling window is visible at a glance. Here a 200k session sits at 53%, yellow:
- Last turn’s output tokens (
↑… out), and graceful states:🧠 …before the first API call or just after/compact,🧠 ctx ?on malformed input. - Account limits on the same line. For Claude.ai Pro/Max, the
⏳ 5hand📆 wkmeters show the 5-hour session window and the weekly limit, each its own accent-coloured bar (blue and magenta) that escalates to yellow past 60% and red past 80%. Any window that is not present is skipped, so nothing changes for API-key sessions.
Account limits, for free
The context meter answers “will this session compact?” The other question that
stops work is “have I hit my plan limit?”, and until now that lived only behind
the /usage screen. Claude Code pipes a rate_limits object on the same stdin
payload, so the status line can show it with no extra call:
five_houris the rolling 5-hour session window (⏳ 5h).seven_dayis the weekly account limit (📆 wk).
Each renders as its own bar with a distinct accent, blue for the session window and magenta for the week, and both escalate to yellow past 60% and red past 80%, so a nearly-spent limit is impossible to miss.
Two caveats are worth knowing. The object appears only for Claude.ai Pro and Max
accounts, and only after the session’s first API response, so an API-key session
or a brand-new one shows just the context meter (the script skips any window that
is absent). And there is no separate Opus-only weekly field in the payload: the
status line exposes the overall session and weekly windows, not the per-model
breakdown that /usage draws.
Why read the native field
The naive approach is to assume a 200k window and divide. That breaks the moment
you switch to an extended-context model. Reading context_window_size means the
meter is correct on any model without a per-model lookup table to keep in sync.
Claude Code already knows the real window, so let it tell you.