I’ve been working on the sink component in clickhouse-etl and decided to add some observability. I wanted to see what was happening under the hood, especially when things slow down or when debugging issues. So I added OpenTelemetry tracing and set up Go profiling with pprof.
Why Tracing?
When you’re processing batches of data and sending them to ClickHouse, it’s not always clear where time is being spent. Is it the schema mapping? The batch preparation? The actual ClickHouse insert? Or maybe the NATS acknowledgment?
With OpenTelemetry tracing, I can see the full flow. Each operation gets a span, and I can see how long each step takes. The trace shows the entire journey from when a batch arrives to when it’s fully processed and acknowledged.
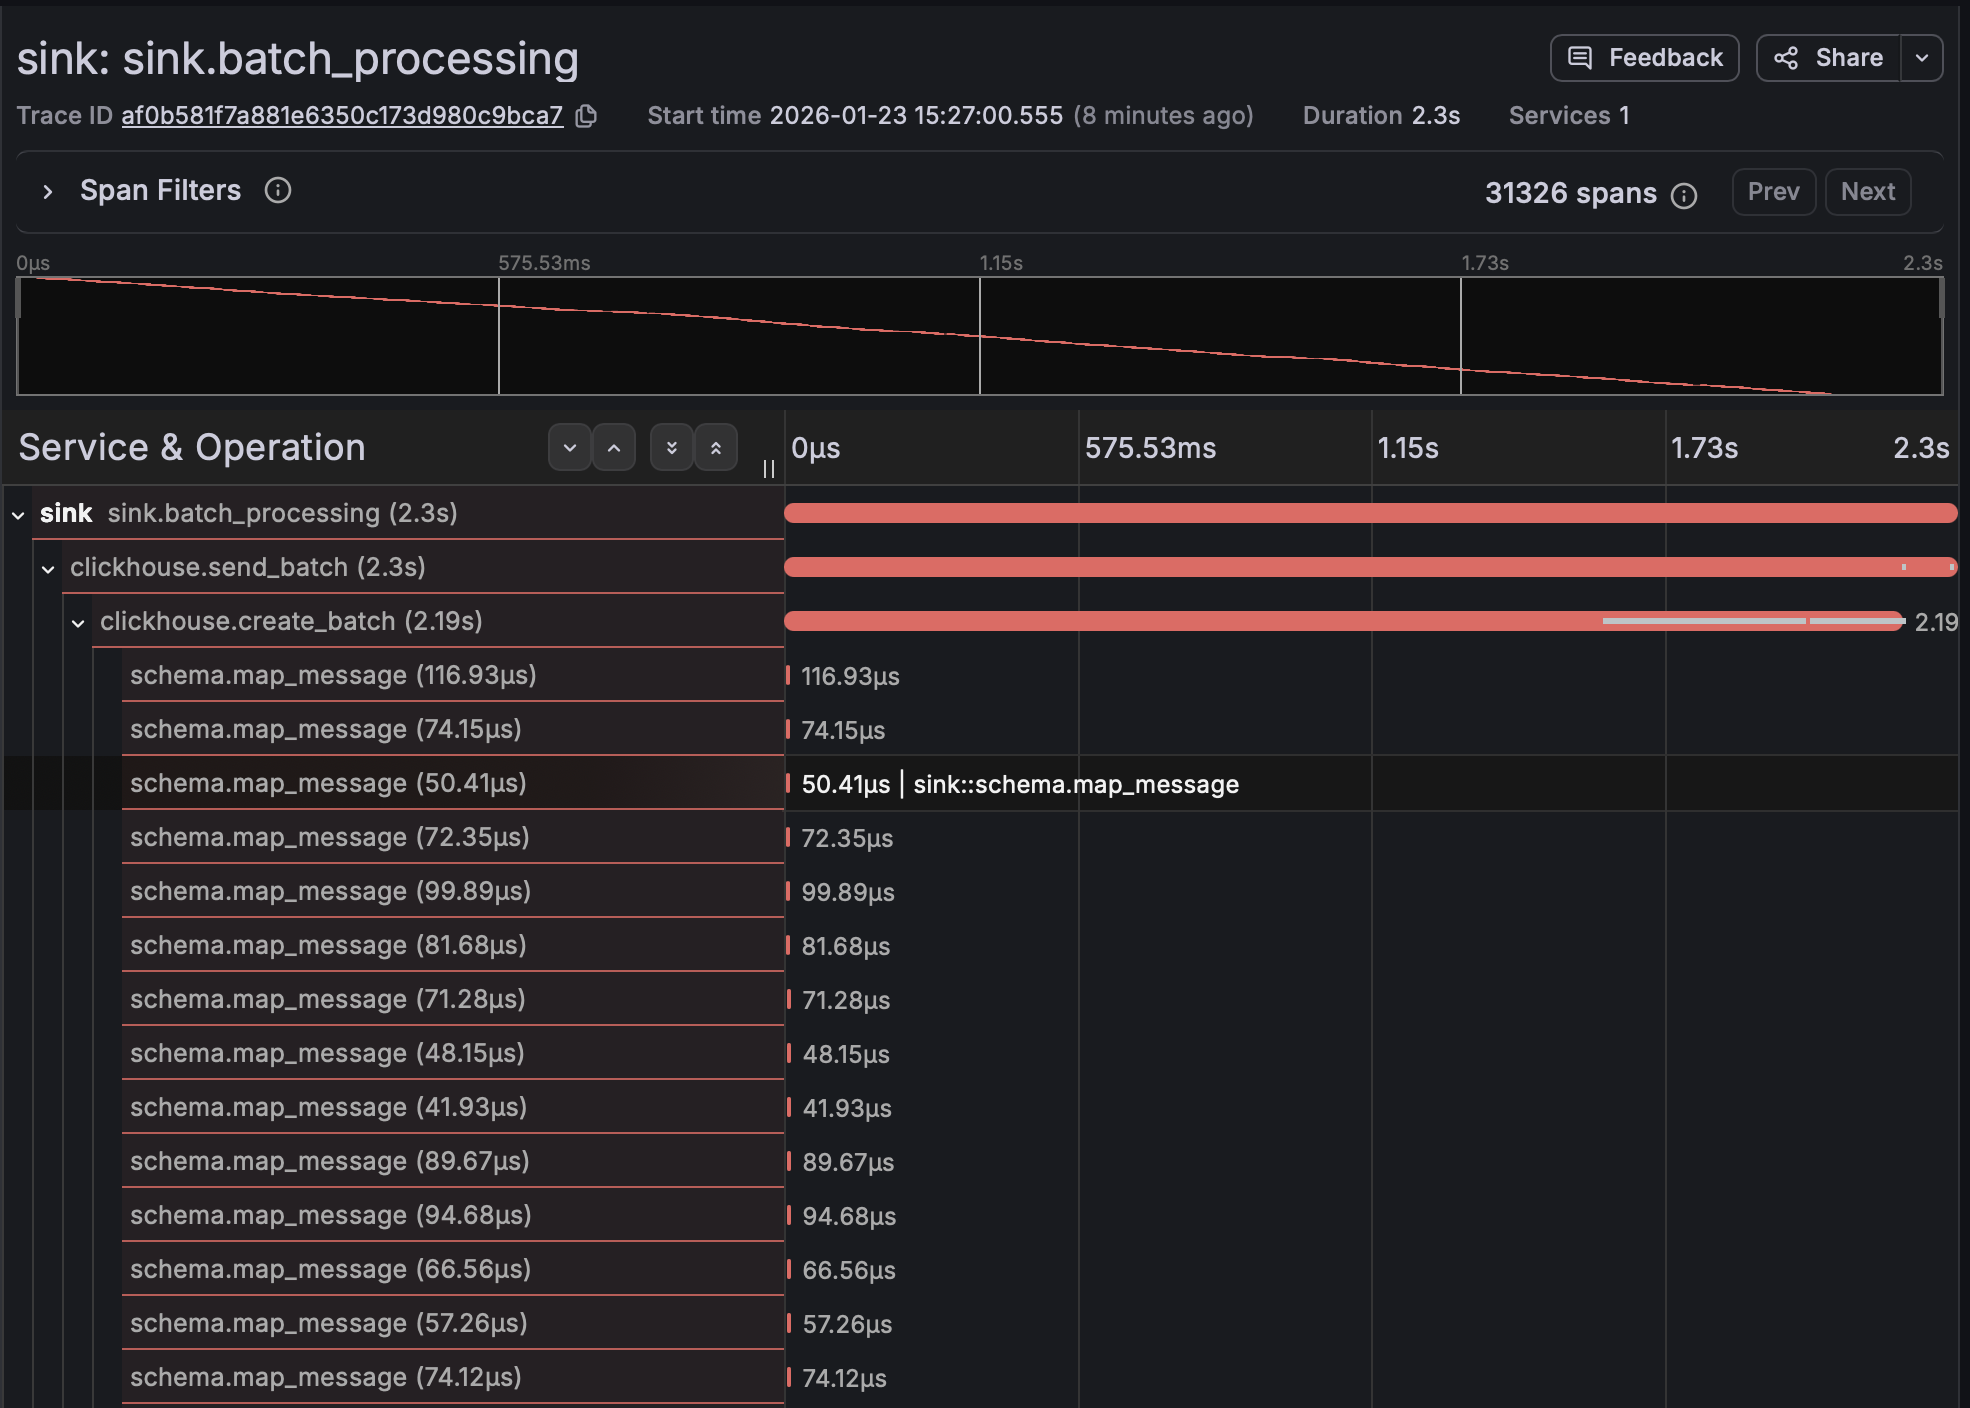
The trace above shows a batch processing operation. You can see the parent span for the entire batch, then child spans for ClickHouse operations, schema mapping, and NATS acknowledgment. This makes it immediately obvious where bottlenecks are.
Go Profiling
Tracing is great for understanding request flow, but for deeper performance analysis, I needed CPU profiling. Go’s pprof tool is perfect for this.
I set up periodic CPU profiling that captures 30-second samples. The flame graph shows where CPU time is actually being spent:
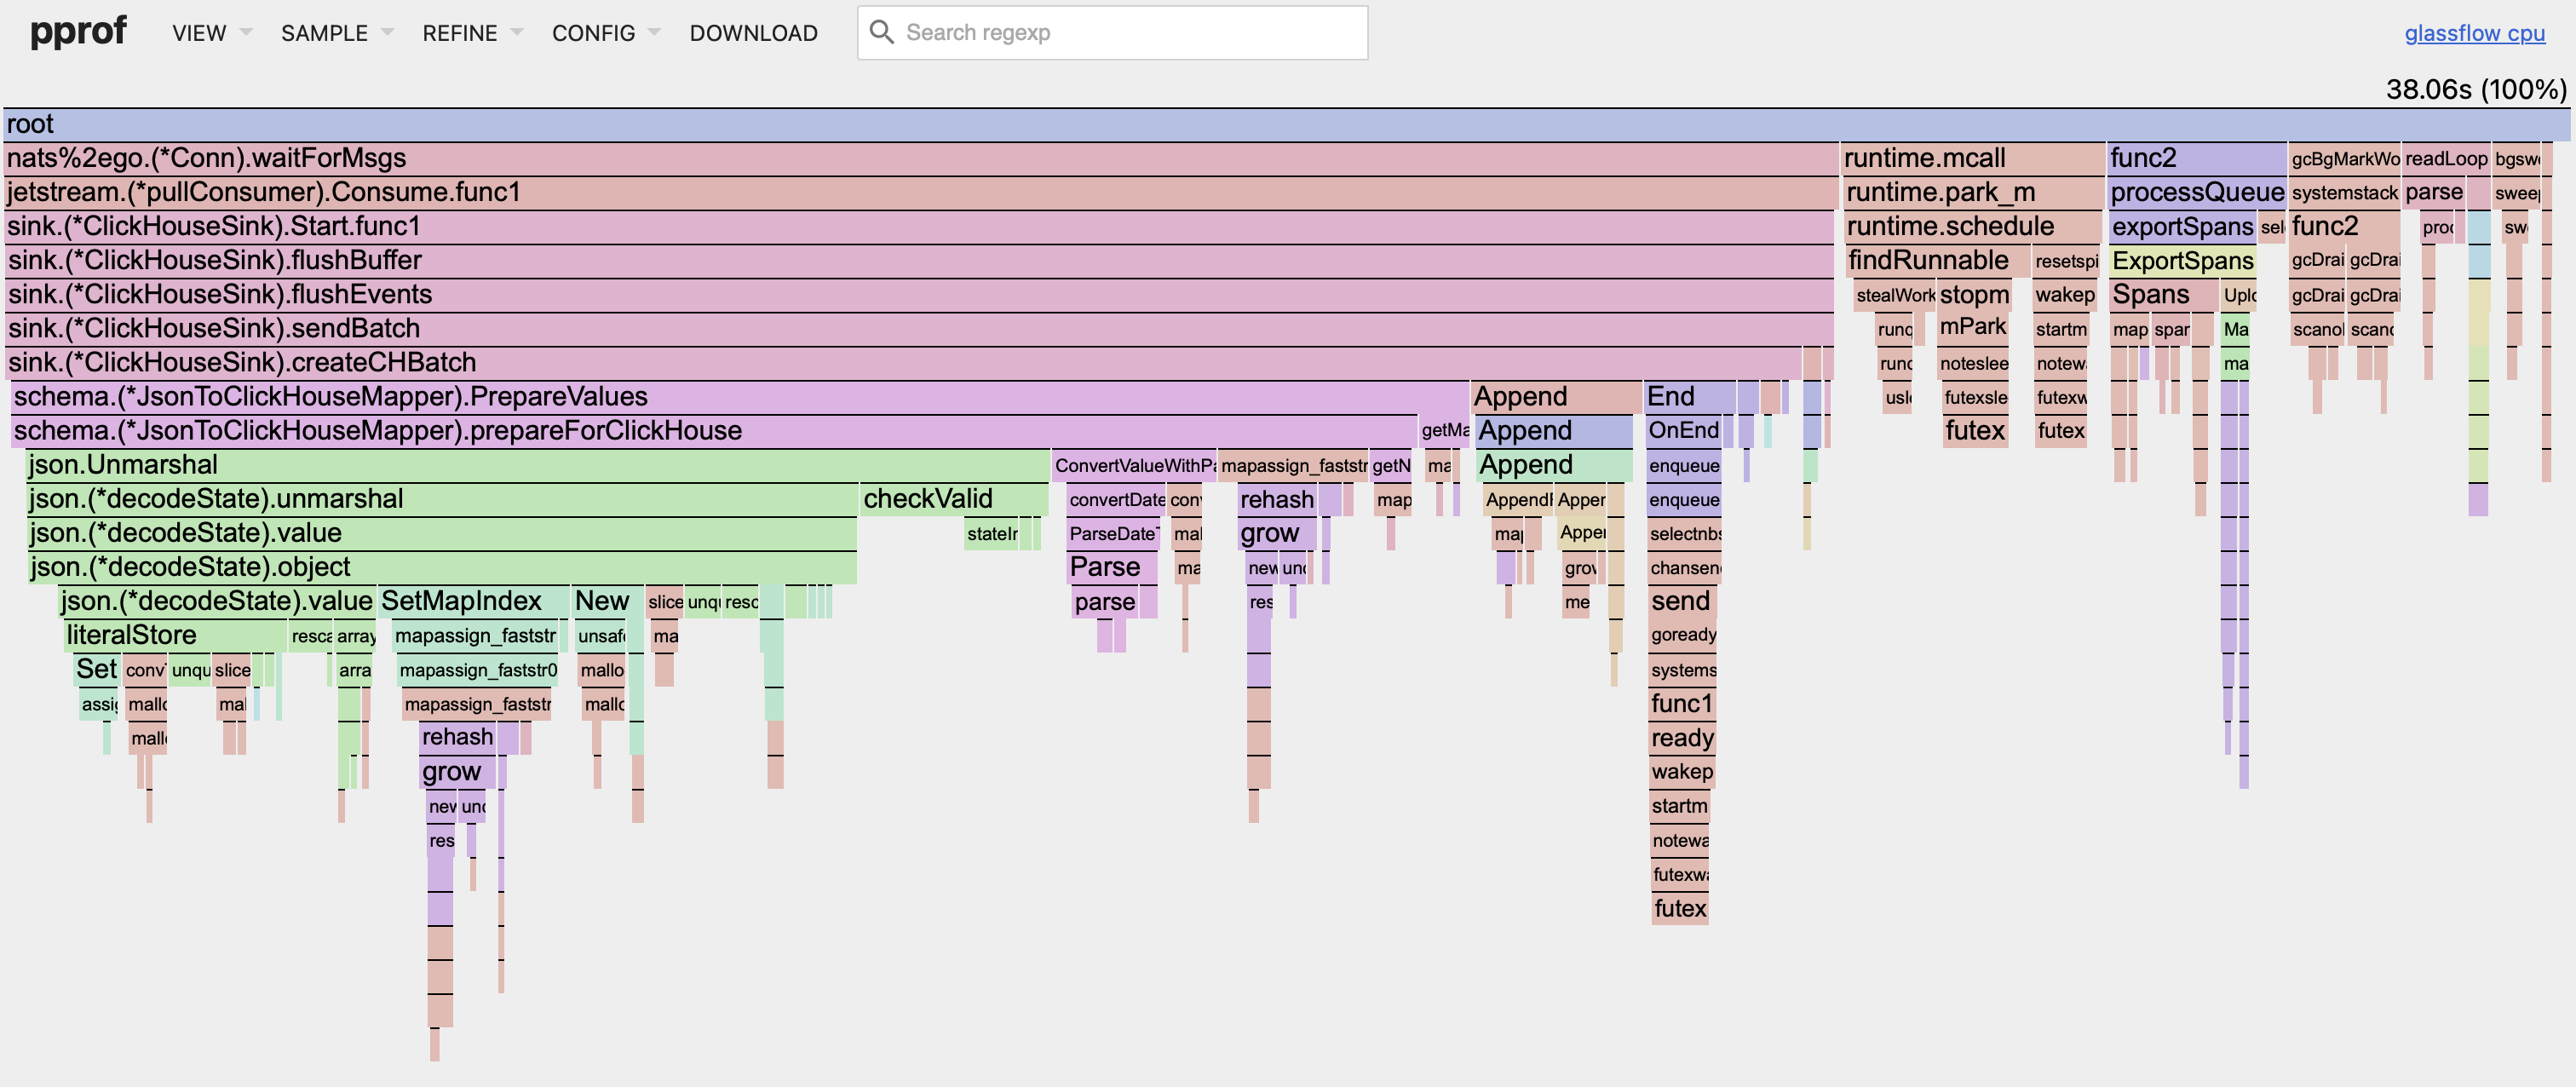
The flame graph makes it easy to spot hot paths. Wide bars mean more CPU time. You can quickly see if there’s a function that’s taking up too much time.
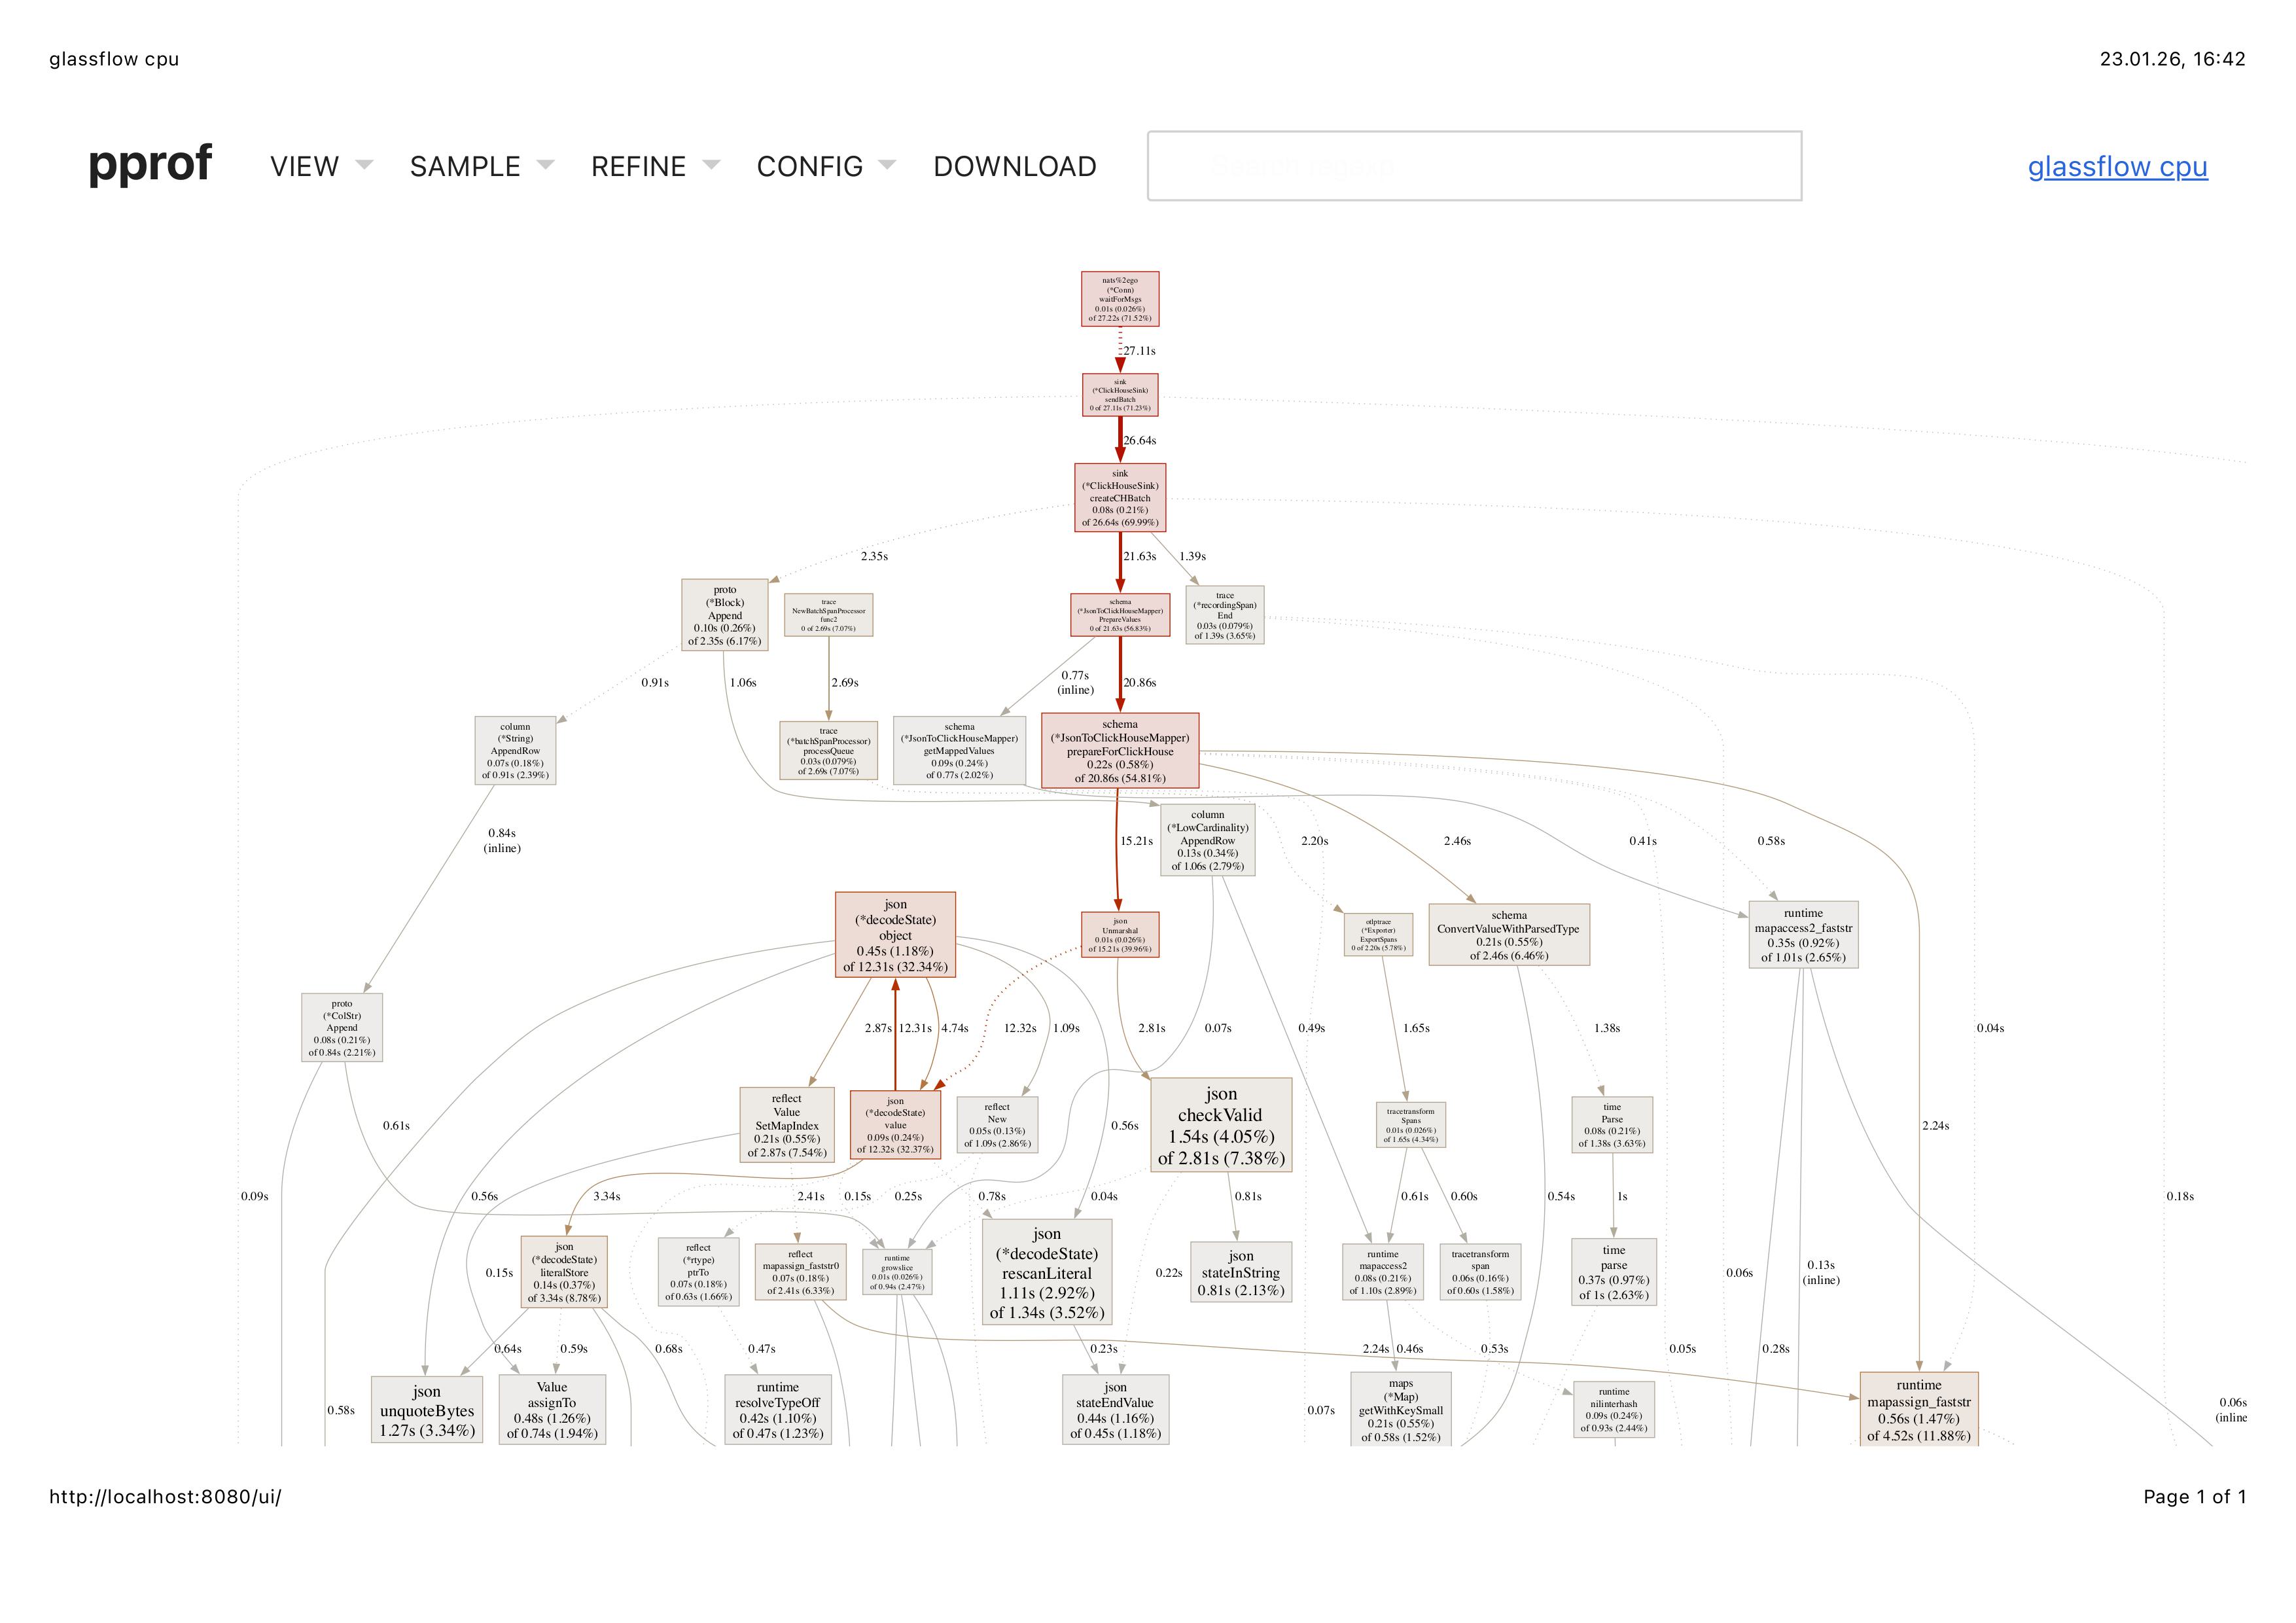
The CPU flow view gives another perspective - showing the call stack and how functions relate to each other:
Setup
The setup is pretty straightforward. For tracing, I’m using OpenTelemetry with OTLP exporter. The tracer is configured to send traces to Tempo (via the OTEL_EXPORTER_OTLP_ENDPOINT environment variable). In the sink component, I create spans for major operations:
- Batch processing (parent span)
- ClickHouse batch preparation
- ClickHouse send operation
- Schema mapping per message
- NATS acknowledgment
For profiling, I’m using Go’s built-in pprof package. The profiler runs periodically, capturing CPU profiles that can be analyzed with go tool pprof or visualized as flame graphs.
Both are enabled when observability is turned on (via the metrics enabled flag). The traces go to Tempo/Grafana, and the profiles are logged (base64 encoded) so they can be extracted and analyzed.
What I Learned
Tracing is incredibly useful for debugging. When something goes wrong, you can see exactly where in the flow it happened. The span attributes give context - batch sizes, durations, errors - all in one place.
Profiling is essential for performance work. The flame graph quickly shows you where CPU time is going. It’s much faster than guessing or adding timing logs everywhere.
Together, they give you both the “what happened” (tracing) and the “why it’s slow” (profiling) perspectives.
I’ll write more about pprof in detail and complete observability setup later, including how to analyze the profiles and set up continuous profiling in production.